Performance Metrics
As of release 24.11, for each release, USD generates performance metrics using a specific set of assets and specific hardware and software configurations. This page describes what metrics are collected, what hardware and software configurations are used, the actual metrics results, and how to generate the metrics locally.
Table of Contents
What We Measure
For a given asset, our performance script captures the following metrics by default (items in bold are reported on this page):
Time to load and configure USD plugins for usdview
Time to open the stage
Time to reset the usdview prim browser
Time to initialize the usdview UI
Time to render first image (in usdview)
Time to shutdown Hydra
Time to close the stage
Time to tear down the usdview UI
Total time to start and quit usdview
Time to traverse the prims in the stage
We run 100 iterations for each asset, and capture the minimum and maximum times for that set of iterations. We also calculate the mean time across the 100 iterations.
For each asset, we first warm the filesystem cache by loading the asset in usdview, to ensure we’re not including cache performance issues in our metrics.
All assets used to measure performance are assumed to be available locally. Time to download assets is not measured or included as part of the gathered performance metrics.
What Environment Is Used
This section describes the computing environment used to generate the published performance metrics. The following operating systems and hardware are currently used.
Note
Machine specifications are subject to change. If specifications do change for a give release, historical performance measurements will be run to backfill any outdated data.
Linux
OS: CentOS Linux 7
CPU: 23 cores of Intel(R) Xeon(R) Platinum 8268 CPU @ 2.90GHz
RAM: 117GB
GPU: NVIDIA TU102GL (Quadro RTX 6000/8000)
macOS
OS: macOS 14.3
CPU: Apple M2 Ultra (20 Core)
RAM: 192GB
GPU: Apple M2 Ultra GPU (76 Core)
Windows
OS: Microsoft Windows 10 Enterprise
CPU: AMD EPYC 7763 64-Core Processor, 2450 Mhz, 31 Core(s), 31 Logical Processor(s)
RAM: 128GB
GPU: NVIDIA RTXA6000-24Q
USD Build
For each of the operating systems and hardware platforms listed previously, we
build USD with the same build configuration. We use a stock invocation of
build_usd.py with the default options (release build, Python components,
imaging and USD imaging components, usdview, etc).
Metrics
Metrics are all measured in seconds.
Performance Graphs Per Platform
The following graphs show the time (in seconds) to open and close usdview for each asset. Graphs are provided for Linux, macOS, and Windows platforms (as described in What Environment Is Used).
Note
A small increase or decrease in performance metrics over different releases may not necessarily indicate an overall performance improvement or regression in USD. Best-case minimum measurements are taken over multiple iterations, but these measurements may still be subject to some variation, so use the below results with caution. We are investigating these sources of variation.
There are known issues with obtaining the create_first_image metric on macOS. We will update published metrics when this issue is resolved.
We are investigating the 25.05 Moore Lane performance regression on linux.
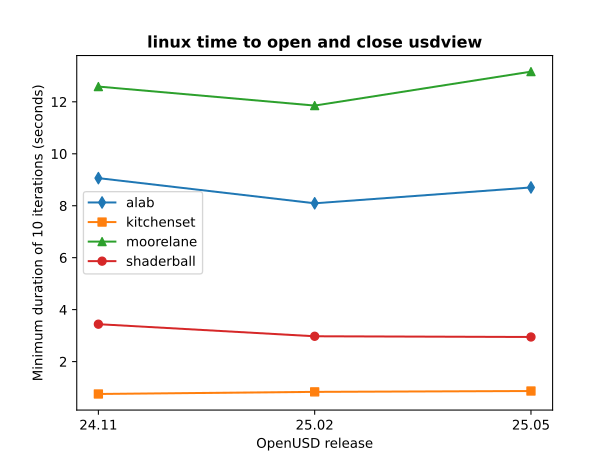
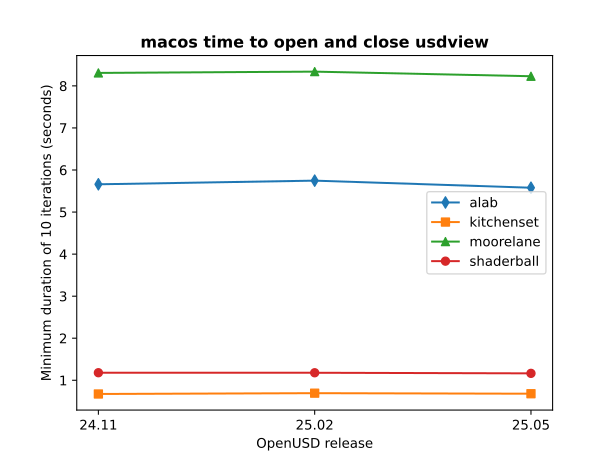
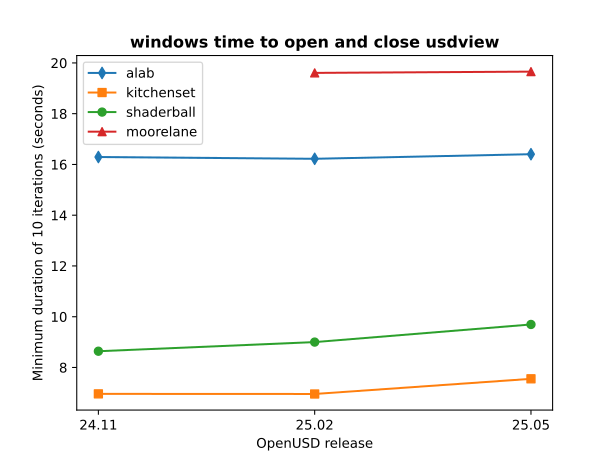
Standard Shader Ball
This asset is designed to be a comprehensive test of a broad array of material properties in a single render. Geometry is expressed using USD, materials are defined using MaterialX, texture maps are provided in OpenEXR format and encoded using the Academy Color Encoding System ACEScg color space.
In our performance sweep we use the mtlx_bubblegum material. Note the
image below may not exactly match the image generated during the performance
run; the primary intention is not necessarily to exercise specific renderers.

The shader ball asset can be downloaded here.
Metric |
24.11 |
25.02 |
25.05 |
|---|---|---|---|
Open stage |
min: 0.154571
max: 0.168689
mean: 0.16472699999999998
|
min: 0.145738
max: 0.191218
mean: 0.16476692
|
min: 0.152122
max: 0.181628
mean: 0.16804495
|
Render first image |
min: 2.80578
max: 2.829025
mean: 2.8189242
|
min: 2.339219
max: 2.549609
mean: 2.40064236
|
min: 2.288085
max: 9.063781
mean: 2.4000510999999998
|
Close stage |
min: 0.000569
max: 0.00095
mean: 0.000746
|
min: 0.000551
max: 0.00172
mean: 0.00083931
|
min: 0.000589
max: 0.001241
mean: 0.00093926
|
Shut down Hydra |
min: 0.022005
max: 0.022807
mean: 0.0223177
|
min: 0.028971
max: 0.036495
mean: 0.03046249
|
min: 0.035442
max: 0.045576
mean: 0.03700483
|
Metric |
24.11 |
25.02 |
25.05 |
|---|---|---|---|
Open stage |
min: 0.096413
max: 0.098173
mean: 0.0973833
|
min: 0.090059
max: 0.096531
mean: 0.09162102
|
min: 0.08718
max: 0.093663
mean: 0.0895949
|
Render first image |
min: N/A
max: N/A
mean: N/A
|
min: N/A
max: N/A
mean: N/A
|
min: N/A
max: N/A
mean: N/A
|
Close stage |
min: 0.000238
max: 0.000339
mean: 0.0002655
|
min: 0.000245
max: 0.001005
mean: 0.00029506
|
min: 0.000236
max: 0.000483
mean: 0.00027492
|
Shut down Hydra |
min: 0.008993
max: 0.013276
mean: 0.0104122
|
min: 0.0112
max: 0.019225
mean: 0.01475921
|
min: 0.011858
max: 0.019994
mean: 0.01478677
|
Metric |
24.11 |
25.02 |
25.05 |
|---|---|---|---|
Open stage |
min: 0.270022
max: 0.300575
mean: 0.2809994
|
min: 0.265009
max: 0.306585
mean: 0.2770631
|
min: 0.255097
max: 0.301206
mean: 0.26899483
|
Render first image |
min: 4.571696
max: 4.745389
mean: 4.6892396000000005
|
min: 4.787113
max: 5.128265
mean: 4.85809605
|
min: 4.852535
max: 11.186214
mean: 5.01563222
|
Close stage |
min: 0.001281
max: 0.002975
mean: 0.0017164
|
min: 0.001221
max: 0.002109
mean: 0.00140918
|
min: 0.001013
max: 0.002825
mean: 0.0015245
|
Shut down Hydra |
min: 0.040251
max: 0.043999
mean: 0.0421298
|
min: 0.052362
max: 0.060537
mean: 0.05581599
|
min: 0.060713
max: 0.080423
mean: 0.06517961
|
Kitchen Set
This asset provides a complex kitchen scene.

The Kitchen Set asset can be downloaded here.
Metric |
24.11 |
25.02 |
25.05 |
|---|---|---|---|
Open stage |
min: 0.069993
max: 0.107452
mean: 0.0842476
|
min: 0.079919
max: 0.129695
mean: 0.09578667
|
min: 0.080612
max: 0.117714
mean: 0.09265372
|
Render first image |
min: 0.279229
max: 0.3028
mean: 0.2903682
|
min: 0.271989
max: 0.464893
mean: 0.29444296
|
min: 0.287641
max: 0.357674
mean: 0.30991565
|
Close stage |
min: 0.007057
max: 0.007835
mean: 0.0074928
|
min: 0.007885
max: 0.014355
mean: 0.00892537
|
min: 0.008111
max: 0.014272
mean: 0.00921452
|
Shut down Hydra |
min: 0.009247
max: 0.009617
mean: 0.0093791
|
min: 0.013788
max: 0.020161
mean: 0.01476924
|
min: 0.013995
max: 0.01997
mean: 0.01467029
|
Metric |
24.11 |
25.02 |
25.05 |
|---|---|---|---|
Open stage |
min: 0.06026
max: 0.09047
mean: 0.0732717
|
min: 0.068011
max: 0.094733
mean: 0.07521936
|
min: 0.064019
max: 0.083588
mean: 0.07094971
|
Render first image |
min: N/A
max: N/A
mean: N/A
|
min: N/A
max: N/A
mean: N/A
|
min: N/A
max: N/A
mean: N/A
|
Close stage |
min: 0.002246
max: 0.002519
mean: 0.0023587
|
min: 0.002071
max: 0.003521
mean: 0.00249618
|
min: 0.002103
max: 0.003613
mean: 0.00251872
|
Shut down Hydra |
min: 0.006481
max: 0.013024
mean: 0.0102488
|
min: 0.008866
max: 0.020057
mean: 0.01476464
|
min: 0.00835
max: 0.019442
mean: 0.01349169
|
Metric |
24.11 |
25.02 |
25.05 |
|---|---|---|---|
Open stage |
min: 0.13587
max: 0.177268
mean: 0.1491912
|
min: 0.111618
max: 0.139086
mean: 0.12787824
|
min: 0.113966
max: 0.138581
mean: 0.12613241
|
Render first image |
min: 2.862769
max: 3.086248
mean: 2.9800833
|
min: 2.917131
max: 3.162327
mean: 2.970126
|
min: 2.817951
max: 3.474417
mean: 2.98876465
|
Close stage |
min: 0.019616
max: 0.024004
mean: 0.0215864
|
min: 0.017333
max: 0.025273
mean: 0.02057523
|
min: 0.016401
max: 0.02549
mean: 0.02164378
|
Shut down Hydra |
min: 0.020476
max: 0.023532
mean: 0.0217044
|
min: 0.021171
max: 0.028106
mean: 0.02360369
|
min: 0.022153
max: 0.031277
mean: 0.02482973
|
ALab
ALab is a full production scene created by Animal Logic and contains over 300 assets, complete with high-quality textures and two characters with looping animation in shot context. Supplied as four separate downloads: the full production scene, high-quality textures, shot cameras matching the ALab trailer, and baked procedural fur and fabric for the animated characters.
The metrics have been measured with the base asset merged with the additional “techvars” info.
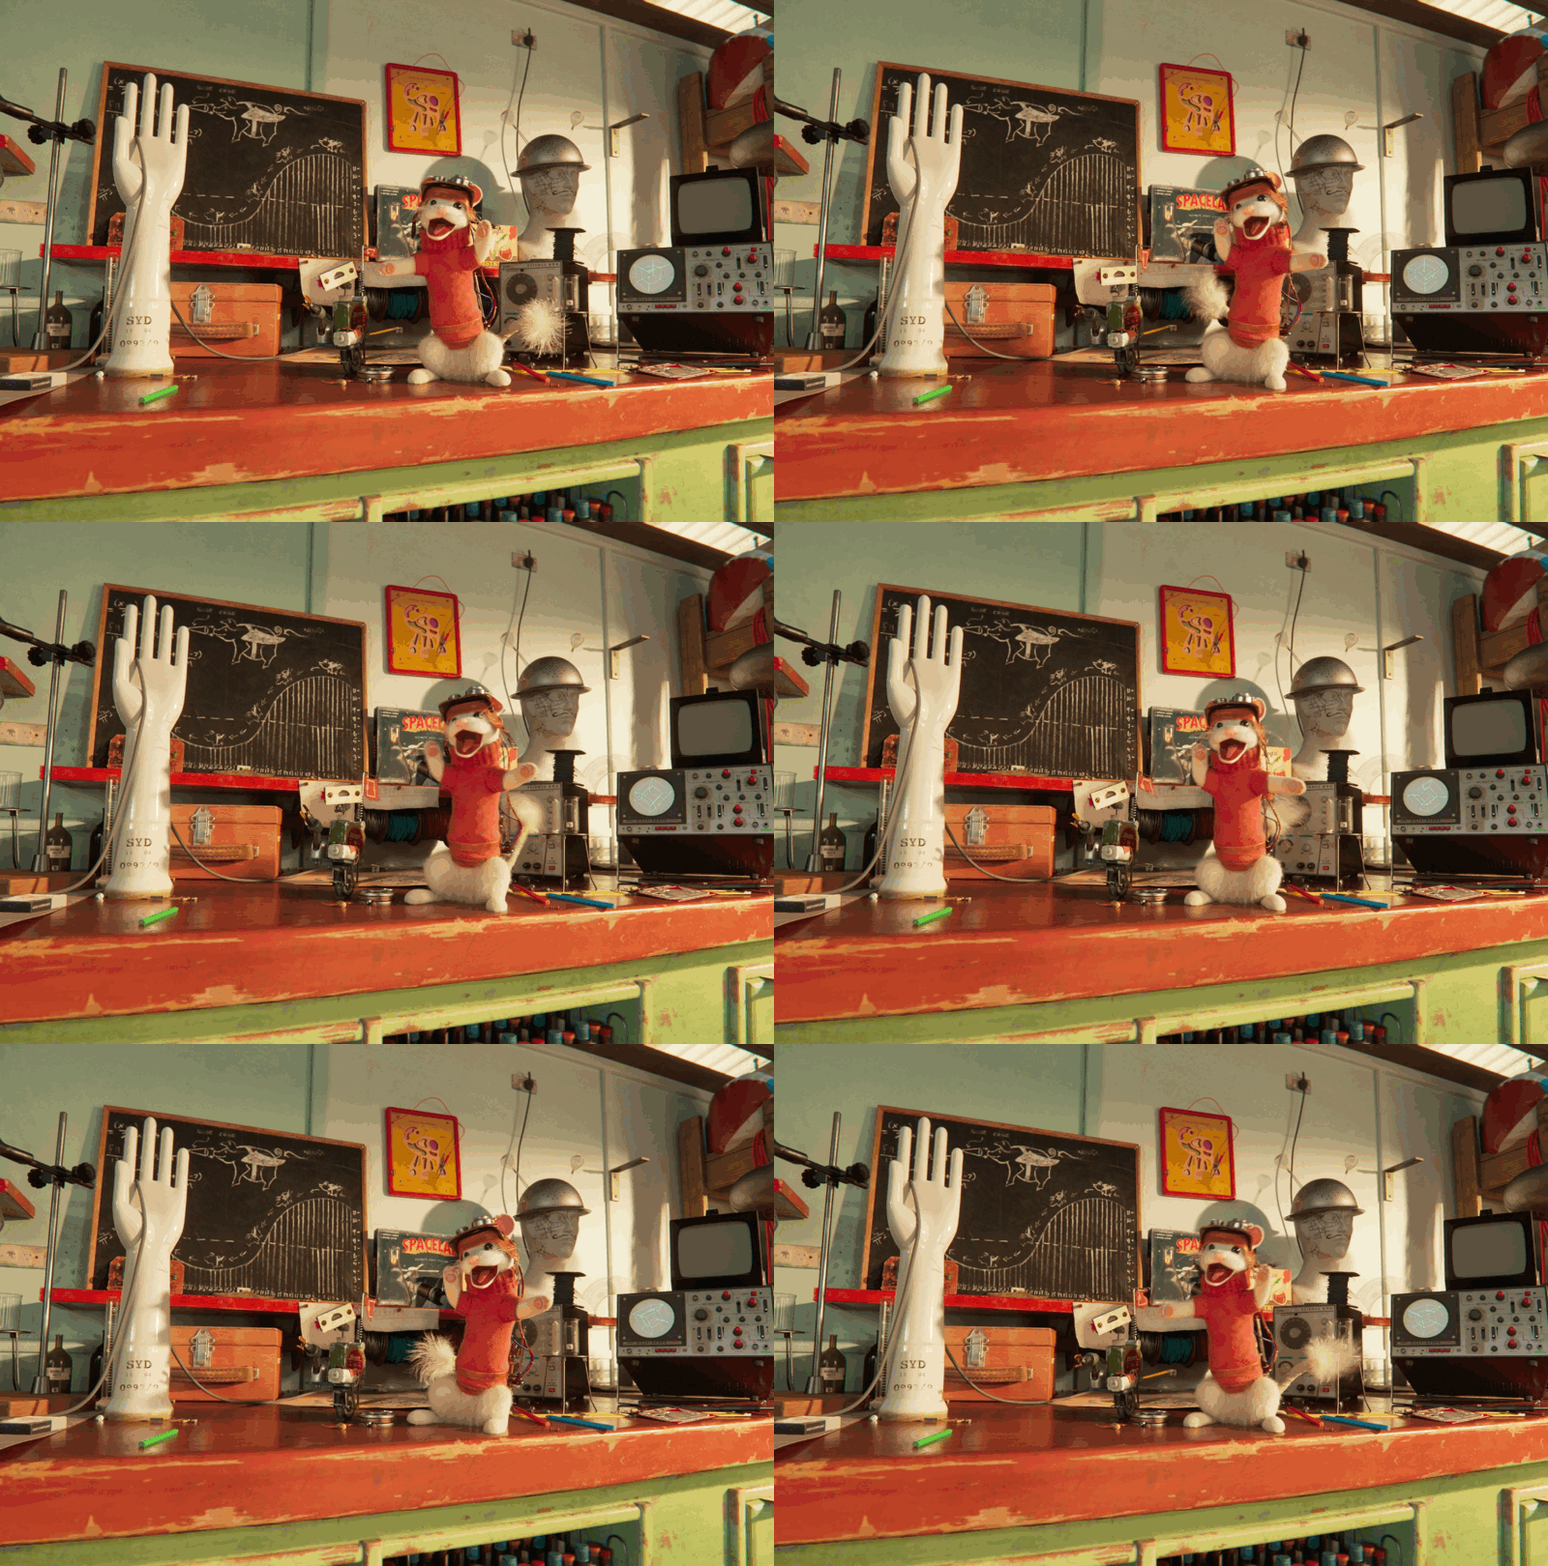
The ALab asset can be downloaded here.
Metric |
24.11 |
25.02 |
25.05 |
|---|---|---|---|
Open stage |
min: 0.39004
max: 0.516364
mean: 0.4642872
|
min: 0.4406
max: 0.563632
mean: 0.50131423
|
min: 0.55127
max: 0.782238
mean: 0.61888838
|
Render first image |
min: 7.897517
max: 8.556198
mean: 8.1684536
|
min: 6.865629
max: 8.149738
mean: 7.57883956
|
min: 7.327838
max: 8.2319
mean: 7.66690162
|
Close stage |
min: 0.084709
max: 0.090772
mean: 0.0874594
|
min: 0.0905
max: 0.269124
mean: 0.09663697
|
min: 0.091385
max: 0.109916
mean: 0.09734432
|
Shut down Hydra |
min: 0.12083
max: 0.165165
mean: 0.1328269
|
min: 0.086453
max: 0.115286
mean: 0.09681611
|
min: 0.089733
max: 0.313577
mean: 0.1043322
|
Metric |
24.11 |
25.02 |
25.05 |
|---|---|---|---|
Open stage |
min: 0.419115
max: 0.44761
mean: 0.4308989
|
min: 0.447765
max: 0.567854
mean: 0.5199257
|
min: 0.446114
max: 0.518793
mean: 0.47762163
|
Render first image |
min: N/A
max: N/A
mean: N/A
|
min: N/A
max: N/A
mean: N/A
|
min: N/A
max: N/A
mean: N/A
|
Close stage |
min: 0.034878
max: 0.041104
mean: 0.037702
|
min: 0.033369
max: 0.046855
mean: 0.03937341
|
min: 0.032355
max: 0.045791
mean: 0.03850542
|
Shut down Hydra |
min: 0.100348
max: 0.120492
mean: 0.10805630000000001
|
min: 0.091086
max: 0.11464
mean: 0.10125593
|
min: 0.081101
max: 0.110275
mean: 0.09709076
|
Metric |
24.11 |
25.02 |
25.05 |
|---|---|---|---|
Open stage |
min: 0.453708
max: 0.465223
mean: 0.4604347
|
min: 0.410067
max: 0.530343
mean: 0.42763175
|
min: 0.524329
max: 0.616512
mean: 0.55108881
|
Render first image |
min: 11.070572
max: 11.738015
mean: 11.290158
|
min: 11.124981
max: 12.310513
mean: 11.36062476
|
min: 10.725459
max: 12.190389
mean: 11.03470107
|
Close stage |
min: 0.337716
max: 0.364083
mean: 0.35308
|
min: 0.285362
max: 0.353328
mean: 0.31994381
|
min: 0.295428
max: 0.375903
mean: 0.33473847
|
Shut down Hydra |
min: 0.219807
max: 0.384717
mean: 0.2734629
|
min: 0.215869
max: 0.452494
mean: 0.30029581
|
min: 0.203839
max: 0.454649
mean: 0.29897051
|
Moore Lane
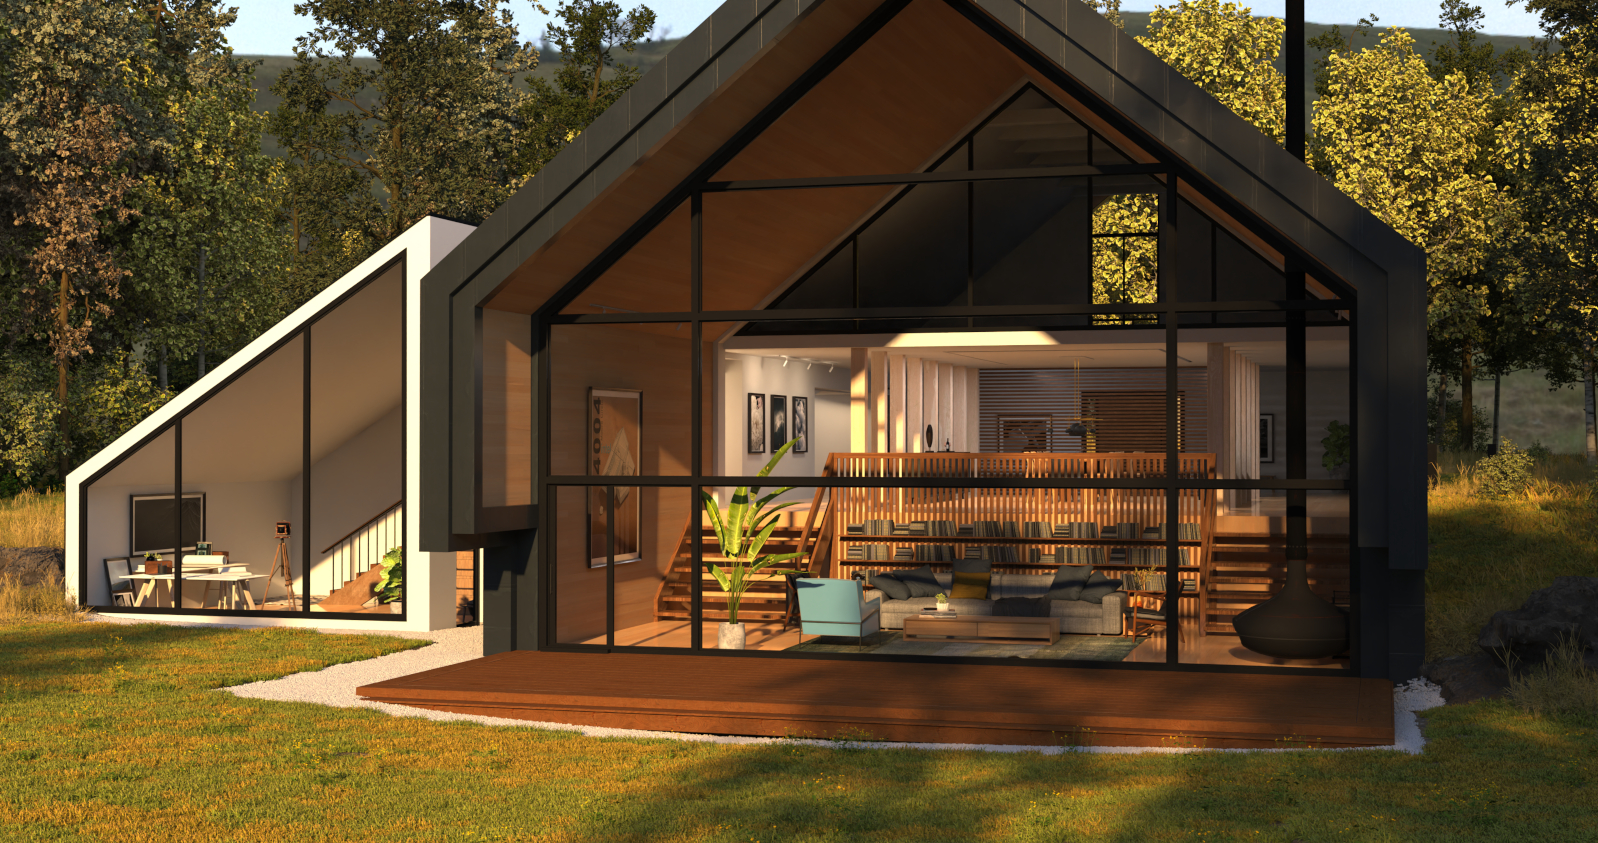
4004 Moore Lane is a fully composed, high-quality scene for the purpose of testing various visual computing issues. The house itself was wrapped around a number of typical problem areas for light transport and noise sampling. This includes things like thin openings in exterior walls, recessed area light sources, deeply shadowed corners, and high-frequency details. The exterior landscape surrounding the house consisted of a relatively simple ecosystem of instanced plants which could provide some additional levels of complexity. In addition to the geometry itself being designed to exacerbate some typical issues, the USD structure itself was created for several layers of testing.
The metrics have been measured using the contained MooreLane_ASWF_0623.usda file.
The Moore Lane asset can be downloaded here.
Metric |
24.11 |
25.02 |
25.05 |
|---|---|---|---|
Open stage |
min: 0.075535
max: 0.094023
mean: 0.0791025
|
min: 0.076916
max: 0.094922
mean: 0.08151592
|
min: 0.071287
max: 0.097127
mean: 0.07692868
|
Render first image |
min: 11.484618
max: 11.776089
mean: 11.6368226
|
min: 10.74976
max: 11.18661
mean: 10.92291829
|
min: 11.959853
max: 13.319375
mean: 12.66771735
|
Close stage |
min: 0.020613
max: 0.02107
mean: 0.0207992
|
min: 0.023531
max: 0.02652
mean: 0.02451658
|
min: 0.03185
max: 0.048383
mean: 0.03333876
|
Shut down Hydra |
min: 0.103945
max: 0.138991
mean: 0.1194904
|
min: 0.060153
max: 0.074561
mean: 0.06535938
|
min: 0.101514
max: 0.156663
mean: 0.11992382
|
Metric |
24.11 |
25.02 |
25.05 |
|---|---|---|---|
Open stage |
min: 0.085466
max: 0.086856
mean: 0.0859231
|
min: 0.086742
max: 0.093883
mean: 0.08819937
|
min: 0.081021
max: 0.087773
mean: 0.0821557
|
Render first image |
min: N/A
max: N/A
mean: N/A
|
min: N/A
max: N/A
mean: N/A
|
min: N/A
max: N/A
mean: N/A
|
Close stage |
min: 0.003298
max: 0.00522
mean: 0.0036797
|
min: 0.003228
max: 0.00909
mean: 0.00396154
|
min: 0.003233
max: 0.009139
mean: 0.00425161
|
Shut down Hydra |
min: 0.222393
max: 0.28412
mean: 0.2741197
|
min: 0.098075
max: 0.329771
mean: 0.29719891
|
min: 0.098344
max: 0.331723
mean: 0.29398898
|
Metric |
24.11 |
25.02 |
25.05 |
|---|---|---|---|
Open stage |
min: N/A
max: N/A
mean: N/A
|
min: 0.144654
max: 0.195054
mean: 0.16251379
|
min: 0.129056
max: 0.19494
mean: 0.14662759
|
Render first image |
min: N/A
max: N/A
mean: N/A
|
min: 14.465477
max: 16.936302
mean: 15.28659683
|
min: 14.190506
max: 15.70013
mean: 14.69402018
|
Close stage |
min: N/A
max: N/A
mean: N/A
|
min: 0.062537
max: 0.082089
mean: 0.06802329
|
min: 0.06399
max: 0.087721
mean: 0.06963007
|
Shut down Hydra |
min: N/A
max: N/A
mean: N/A
|
min: 0.425902
max: 0.662102
mean: 0.48684717
|
min: 0.375697
max: 0.482632
mean: 0.42639765
|
Running Performance Metrics Locally
We encourage developers to run the USD performance metrics to measure performance impacts of OpenUSD code contributions. Performance metrics can also be run to validate local runtime environments and hardware configurations.
Performance metrics are generating using the usdmeasureperformance.py
script found in pxr/extras/performance. See the
usdmeasureperformance tool docs for more
information on the different parameters available.
usdmeasureperformance.py uses usdview and testusdview, so you will need to make sure those are in your current path, or aliased properly.
For gathering the metrics published on this page, the following parameters are used (for each asset):
python usdmeasureperformance.py <asset.usda> -i 100 -a min -o <metrics output filename.yaml>
Optionally, –tracedir <dir> will output trace information to dir that may aid in performance debugging.
Adding Custom Metrics
You can add your own custom metrics and have usdmeasureperformance.py include them as part of the set of metrics that it measures.
To define a custom metric, create a script file that defines a
testUsdviewInputFunction() function that will be passed to testusdview.
For example, if you wanted to add a metric named “process prims”, that
traversed the stage and processed each prim in some way, you might have a
processPrimsMetric.py script that looks something like:
from pxr import Usd, UsdUtils, Usdviewq

def testUsdviewInputFunction(appController):
    with Usdviewq.Timer("process prims", True):
        stage = appController._dataModel.stage
        for prim in stage.Traverse():
            # process prim as needed, etc
See also the “traverse stage” example in pxr/extras/performance/explicitMetrics/stageTraversalMetric.py.
To include your custom metrics when running usdmeasureperformance.py,
add your metrics script name and metric name as part of the --custom-metrics
script parameter. For example, if you wanted to include the “process prims”
metric example for “MyTestAsset.usda”, you would use a
usdmeasureperformance.py command line similar to:
python usdmeasureperformance.py MyTestAsset.usda --custom-metrics processPrimsMetric.py:'process prims'
usdmeasureperformance.py will look for your custom metric script relative to the directory from which the usdmeasureperformance.py script is run.